
TRENDING WHITEPAPERS,VIDEOS & MORE


OTHER EDUCATIONAL CONTENT


tim
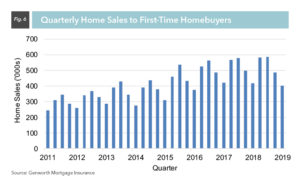
Genworth Releases Its First-Time Homebuyers Market Report
- Wednesday, 22 May 2019

Written by Genworth Mortgage Insurance's Chief Economist Tian Liu, this report highlights the following takeaways:
The first-time homebuyer market continued to slow down in Q1, but still out-performed the rest of the housing market.
First-time homebuyers purchased 401,000 single-family homes in Q1, down three percent from a year ago. This was the first back-to-back decline in the first-time homebuyer market this cycle, dating back to 2011.
The slowdown in the first-time homebuyer segment was less pronounced as compared to other buyers, however. For example, home sales to repeat buyers fell by six percent year over year, and sales to cash buyers were down by seven percent.
This is a reminder that first-time homebuyers differ from other buyer groups in terms of why they buy. Their purchase decisions are more likely driven by the fact that many are starting families and reaching their early-30s, historically the peak home-buying ages. In fact, the importance of first-time homebuyers has increased during the past two quarters as sales to other homebuyers have slowed even more.
The slowdown in the first-time homebuyer segment spread to more states in Q1 as 38 states reported less first-time homebuyer activity compared to last quarter’s 31 states . Arizona, Florida, and Georgia, for example, which had reported flat or growing numbers of first-time homebuyers last quarter, reported fewer first-time homebuyers in Q1 compared to a year ago. Only 14 states, including North Carolina, Iowa, and Connecticut, reported more.
Besides affordability challenges, the government shutdown in January also contributed to the slowdown in the first-time homebuyer market by disrupting lending programs such as USDA’s Single-Family Housing Loan Guarantee Program, which reported 6,000 fewer first-time homebuyers in Q1 compared to a year ago, a 30 percent decline. But the impact of the government shutdown on the overall first-time homebuyer market appears to have been modest.

Lower interest rates and slower growth in home prices helped affordability improve for the first time since 2015.
Housing affordability has been deteriorating in the past three years because home prices and interest rates have been rising together. That trend reversed in Q1 as a slower housing market cooled home price growth and the expectation of a pause in monetary tightening pushed mortgage rates down further.
While the Freddie Mac Primary Market Survey showed a 41-basis point drop in the 30-year conventional mortgage rate over the last quarter, our data suggests a more muted decrease for first-time homebuyers with the average interest rate falling by just 15 basis points (Figure 8). This is largely because government loans likely take longer to process than conventional loans, so home sales financed by government loans were locked in earlier in the quarter when rates had been higher.
In March, the gap between the average interest rate facing first-time homebuyers and the Freddie Mac conventional rate was 50 basis points. As interest rates fully catch up in Q2, first-time homebuyers will likely see a smaller gap between the interest rate they face and what other homebuyers face, implying further savings on their borrowing costs.

The year-over-year growth rate in home values, based on the Federal Housing Finance Agency’s purchase-only index, slowed to around five percent in Q1 compared to 5.7 percent in Q4. Many other measures of home prices have shown similar slowdowns this quarter.
Quarter over quarter, home values were largely unchanged. As a result, it was lower interest rates that helped improve housing affordability this quarter.
The slowdown in the housing market in the second half of 2018 and its ongoing reversal once again demonstrates the importance of affordability to the housing market. While the improvement is positive, housing affordability remains lower compared to the recent past, which will limit the rebound in first-time homebuyer demand.

Low down payment mortgages remain crucial for first-time homebuyers.
The slowdown in the housing market and the suspension of monetary tightening have created some breathing space for the first-time homebuyer market this quarter. But first-time homebuyers remain highly dependent on affordable mortgage products and lower-priced homes.
For many, if not most, first-time homebuyers, a 20 percent down payment will always be beyond what they can save. That is why 80 percent of first-time homebuyers used some form of low down payment mortgages this quarter.

Conventional mortgages, enabled by the private mortgage insurance industry, were the most widely used mortgage product for first-time homebuyers. They were used by more than 133,000 first-time homebuyers in Q1, five percent more than last year. For the past four quarters, the low down payment conventional mortgage has been the leading mortgage product for first-time homebuyers.

CONCLUSION
While sales to first-time homebuyers continued to slow in Q1, we believe that the rebound in housing affordability is continuing as lower interest rates at the end of Q1 are passed to borrowers and interest rates on government loans catch up to those on conventional loans. Home price growth also has cooled in the past few months as housing demand has slowed while inventory has increased. Wage growth also has accelerated, giving potential homebuyers more purchasing power.
If affordability continues to improve, it should help both first-time homebuyers and repeat buyers in the current home selling season. That being said, inventory also remains quite low in Q1, and could easily fall again once demand recovers.
It also is unclear if homebuilders will be able to increase the number of low-priced single-family homes affordable to first-time homebuyers. Without an increased supply of affordable new homes, home prices could easily re-accelerate, slowing the growth of home sales to first-time homebuyers.
Longer term, the housing industry must find solutions to keep homes affordable without being overly dependent on monetary policy support and cooling housing market conditions. That means looking for solutions to lower the cost of building, buying, selling and financing homes.
Home Diversification Corp Offers News Way To Diversify Housing Price Risk
- Tuesday, 21 May 2019

Home Diversification Corp., a startup Fintech financial product provider, today announced that it will begin selling its signature solution for the newly established Home Diversification Industry (HD) in the 3rd-quarter of this year. Their product – Home Diversification Agreement – will be made available to industry partners and the general public at that time.
The HDC Agreement enables homeowners to switch their volatile local-market home price value (typically 72-percent more volatile) for that of a broader and more stable countrywide home price index. This new product is designed to reduce risk for all stakeholders and provide much needed stability to the housing finance system.
The HD concept is currently undergoing a rigorous study by a highly-regarded industry research organization, the purpose of which is to determine validity and to quantify the percent of risk reduction for lenders and homeowners.
The company obtained previous validation of this approach and their product through an extensive internal study and that of a well-respected academic institution (Cornell University), in addition to a tremendous amount of back testing and analysis.
The HDC Agreement marks the first time ever homeowners have been able to diversify and reduce price risk for what is typically their single-most consolidated asset – their home. Home equity value (price) and foreclosure risk are reduced up to 40-percent. And systemic credit-loss risk for lenders is reduced up to 70-percent.
Having founded the concept of home diversification, HDC plans to lead the new market with a series of signature solutions, including standard home diversification for new and existing homeowners, as well as high LTV/"low" to "no down" products for new buyers that work in conjunction with mortgage insurance, or provide "stand-alone" credit enhancement for non-QM/PLS customers.
"We've talked with influential groups and individuals throughout the home finance industry and they all agree that the concept of home diversification will transform the market for both homeowners and lenders," states Marc Biron, HDC founder and CEO. "Most wonder why this has never been introduced in the past. Without doubt, this new home diversification product is the most important financial innovation since securitization."
"Home diversification will become a standard component on the homeownership checklist, along with inspections, appraisals, mortgages, home insurance and the like," adds HDC President David Margulies, a 30-yr plus veteran of the mortgage finance industry. "Our product is going to be a shot in the arm for players across the spectrum seeking to differentiate and gain share in the incredibly competitive home finance space."
Read more...U.S. Home Values Fall for the First Time in Seven Years
- Sunday, 19 May 2019

U.S. home values fell from March to April, the first month-over-month decline since February 2012, according to the April Zillow® Real Estate Market Reporti.
The typical U.S. home is worth $226,800, down 0.1% from last month. The decline – led primarily by large West Coast markets – comes after 85 straight months of gains that brought home values to record highs. U.S. home values have experienced declines only twice over the past few decades: during the recession of the early 1990s and the Great Recession and housing crisis in the late 2000s.
On an annual basis, home values grew 6.1%. But the pace of year-over-year appreciation has slowed in each of the past four months, falling from 8.1% annual growth as recently as December.
Home values fell in 32 of the 35 largest housing markets over April and remained flat in two others. Riverside, Calif., was the only large market that saw its home values appreciate during the month. This downturn has been a longer-term trend in other large California markets – home values have fallen in at least each of the previous three months in San Jose, San Francisco, San Diego and Los Angeles.
"The widespread decline in home value growth in April – the first in many years – will turn heads. But it's too early to say if we've hit another national home value peak and are at the beginning of a sustained downturn, or if this is just a bump in the road," said Zillow Director of Economic Research Skylar Olsen. "Month-over-month numbers are volatile, and this small decline could reverse itself before the year is out and before national home values go negative on a year-over-year basis. That said, the likelihood that home values have peaked in several local markets is real. The price correction in these areas should continue after years of significant home value growth that substantially outpaced income growth."
Home values have likely peaked in Los Angeles, Philadelphia, Houston, Miami, Boston, San Francisco, Seattle, San Diego, St. Louis, Tampa, Baltimore, Pittsburgh, Portland and San Jose.
Rent prices continued to accelerate, growing for the sixth consecutive month. The median U.S. rent rose 2.6% on an annual basis to $1,477. Rents grew the fastest in Las Vegas (up 7.8%), Phoenix (up 6.7%) and Orlando (up 6.4%).
Inventory fell 1.7% year-over-year in the U.S. Washington, D.C., has seen the most significant drop, with 31.7% fewer homes for sale than this time a year ago.
Despite the drop nationally, for-sale inventory has grown significantly in expensive West Coast markets San Jose, Seattleand San Francisco – this is due to cooling demand rather than a flood of new listings.
Mortgage rates listed on Zillow rose slightly in April. Rates grew as high as 4.17% before ending the month at 4.06%, up four basis points from April 1. Zillow's real-time mortgage rates are based on thousands of custom mortgage quotes submitted daily to anonymous borrowers on the Zillow Mortgages site and reflect the most recent changes in the market.
| Metropolitan Area | Median Home Value, April 2019 |
Home Value Month- over- Month Change |
Home Value Year-over- Year Change |
Median Rent,April 2019 |
Rent Year- over- Year Change |
Inventory Year-over- Year Change |
| United States | $226,800 | -0.1% | 6.1% | $1,477 | 2.6% | -1.7% |
| New York, NY | $442,500 | 0.0% | 4.1% | $2,419 | 1.6% | 3.4% |
| Los Angeles-Long Beach-Anaheim, CA |
$649,500 | -0.3% | 1.4% | $2,835 | 3.2% | 17.4% |
| Chicago, IL | $225,900 | -0.2% | 3.0% | $1,696 | 3.5% | 3.7% |
| Dallas-Fort Worth, TX |
$243,900 | -0.3% | 7.6% | $1,646 | 3.1% | 10.6% |
| Philadelphia, PA | $232,800 | -0.4% | 2.8% | $1,611 | 2.8% | -11.1% |
| Houston, TX | $205,600 | -0.3% | 4.6% | $1,585 | 2.3% | 3.8% |
| Washington, DC | $407,700 | -0.1% | 2.4% | $2,176 | 2.2% | -31.8% |
| Miami-Fort Lauderdale, FL |
$283,400 | -0.5% | 5.0% | $1,928 | 3.3% | 3.8% |
| Atlanta, GA | $219,600 | -0.1% | 9.6% | $1,452 | 4.3% | 8.9% |
| Boston, MA | $465,000 | -0.6% | 3.7% | $2,401 | 2.1% | 13.3% |
| San Francisco, CA | $946,700 | -0.5% | 1.3% | $3,455 | 1.7% | 19.7% |
| Detroit, MI | $162,200 | 0.0% | 6.9% | $1,228 | 2.7% | 12.2% |
| Riverside, CA | $370,100 | 0.1% | 4.8% | $1,993 | 5.5% | 6.2% |
| Phoenix, AZ | $266,600 | -0.1% | 6.0% | $1,452 | 6.7% | -1.0% |
| Seattle, WA | $491,600 | -0.4% | 2.2% | $2,236 | 2.5% | 22.8% |
| Minneapolis-St Paul, MN |
$270,700 | 0.0% | 5.1% | $1,704 | 4.3% | -5.5% |
| San Diego, CA | $590,700 | -0.1% | 1.2% | $2,650 | 4.3% | 10.9% |
| St. Louis, MO | $166,500 | -0.3% | 4.1% | $1,162 | 2.1% | -10.8% |
| Tampa, FL | $213,800 | -0.4% | 5.7% | $1,446 | 4.8% | 4.8% |
| Baltimore, MD | $267,800 | -0.3% | 1.9% | $1,754 | 1.0% | -17.3% |
| Denver, CO | $407,900 | -0.2% | 3.3% | $2,114 | 3.3% | 17.5% |
| Pittsburgh, PA | $143,200 | -0.7% | 2.9% | $1,105 | 3.3% | -12.2% |
| Portland, OR | $397,400 | -0.4% | 3.1% | $1,875 | 2.1% | 4.1% |
| Charlotte, NC | $208,500 | 0.0% | 8.7% | $1,346 | 4.2% | 3.8% |
| Sacramento, CA | $411,500 | 0.0% | 3.7% | $1,919 | 4.2% | -1.3% |
| San Antonio, TX | $194,100 | -0.2% | 5.7% | $1,373 | 2.8% | 15.8% |
| Orlando, FL | $238,900 | -0.1% | 7.5% | $1,536 | 6.4% | 5.0% |
| Cincinnati, OH | $169,900 | -0.3% | 7.5% | $1,307 | 2.5% | -1.8% |
| Cleveland, OH | $146,500 | -0.2% | 5.2% | $1,168 | 2.5% | N/A |
| Kansas City, MO | $192,900 | -0.2% | 7.9% | $1,299 | 2.5% | -24.1% |
| Las Vegas, NV | $279,900 | -0.2% | 9.0% | $1,402 | 7.8% | 14.5% |
| Columbus, OH | $192,000 | -0.3% | 7.2% | $1,366 | 3.0% | -2.0% |
| Indianapolis, IN | $166,800 | -0.1% | 11.5% | $1,237 | 3.3% | N/A |
| San Jose, CA | $1,193,600 | -1.4% | -2.7% | $3,562 | 1.8% | 38.7% |
| Austin, TX | $311,300 | -0.2% | 5.7% | $1,711 | 2.0% | -4.4% |
Read more...