The number of homes that were flipped in 2018 fell 4 percent, compared with the previous year.
Fully 207,957 U.S. single family homes and condos were flipped in 2018, compared with 216,537 in 2017, according to the “Year-End 2018 U.S. Home Flipping Report” from Attom Data Solutions.
The 207,957 homes flipped in 2018 represented 5.6 percent of all single-family home and condo sales during the year and was unchanged from 5.6 percent of all sales in 2017. That’s up from 5.1 percent of all sales back in 2008.
Fully 146,020 entities (individuals and institutions) flipped homes in 2018, down 0.4 percent from the 146,623 entities that flipped in 2017, but up 63.1 percent, 89,539, properties that were flipped 10-years ago.
[adbutler zone_id="326324"]
[adbutler zone_id="326327"]
"With mortgage rates remaining strong and people staying in their homes longer, we have started to see a bit of a flipping rate slowdown," said Todd Teta, chief product officer at Attom Data. "However, this isn't to say home flipping is going away. The market is still ripe with investors flipping and bargains still await, especially in the lowest-priced areas of the country, where levels of financial distress remain highest."
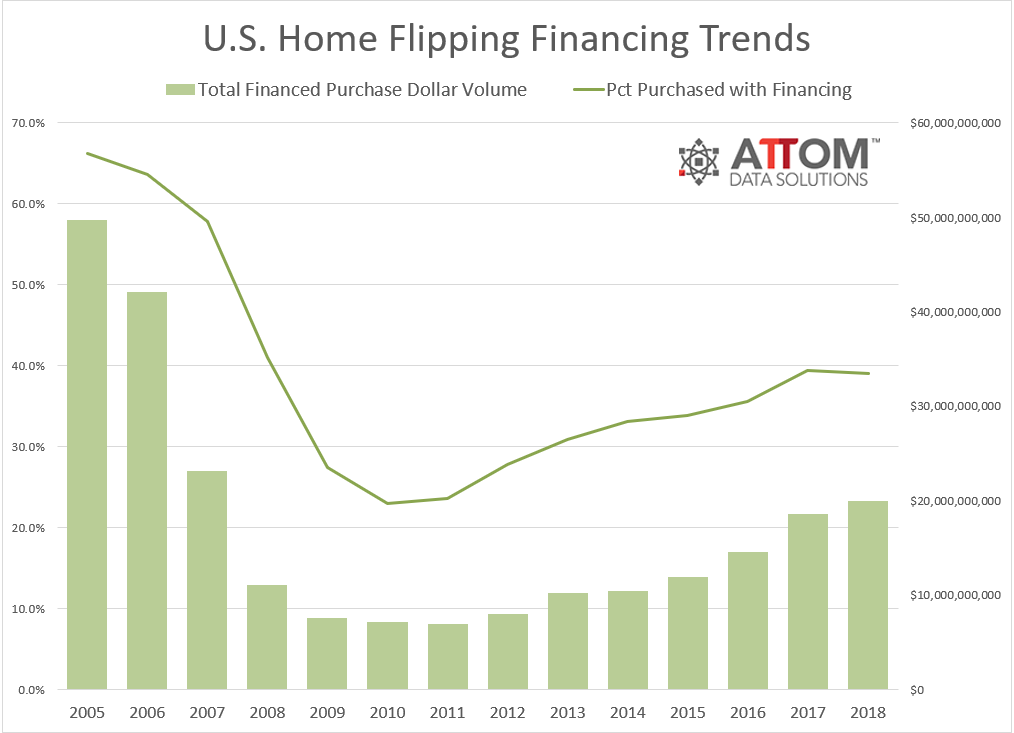
The value of financed home flip purchases was $19.9 billion for homes flipped in 2018, up 8 percent from $18.5 billion in 2017 to the highest level since 2007--an 11-year high.
Flipped homes originally purchased by the investor with financing represented 39.1 percent of homes flipped in 2018, down from 39.4 percent in 2017 and down from 41.0 percent in 2008.
 Among 53 metropolitan statistical areas analyzed in the report with at least 1 million people, those with the highest percentage of 2018 completed flips purchased with financing were Denver, Colorado (53.7 percent); Providence, Rhode Island (51.8 percent); Seattle, Washington (51.8 percent); San Diego, California (51.6 percent); and San Francisco, California (50.8 percent).
Of the homes flipped in 2018, 13.8 percent were sold to FHA borrowers—likely first-time homebuyers—down from 17 percent in 2017 to an 11-year low.
Among 53 metro areas analyzed in the report with at least 1 million people, those with the smallest share of completed flips sold to FHA buyers in 2018 were San Jose, California (1.3 percent); Raleigh, North Carolina (4.3 percent); San Francisco, California (6.0 percent); Memphis, Tennessee(6.5 percent); and San Diego, California (7.2 percent).
Among the 53 metro areas analyzed in the report with at least 1 million people, those with the highest share of completed flips sold to all-cash buyers — often other real estate investors — in 2018 were Detroit, Michigan (48.8 percent); Birmingham, Alabama (42.4 percent); Jacksonville, Florida(39.8 percent); Miami, Florida (38.3 percent); and Buffalo, New York (38.0 percent).
Completed home flips in 2018 yielded an average gross profit of $65,000 (difference between median purchase price and median flipped sale price), down 3 percent from an average gross flipping profit of $66,900 in 2017.
The average gross flipping profit of $65,000 in 2018 represented an average 44.8 percent return on investment (percentage of original purchase price), down from 50.3 percent in 2017 and down from


