
TRENDING WHITEPAPERS,VIDEOS & MORE


OTHER EDUCATIONAL CONTENT


tim
Small Dollar Mortgages Are No Riskier Than Mid-Size Mortgages
- Wednesday, 24 April 2019

By Alanna McCargo and Sarah Strochak, Urban Institute
The difficulty of obtaining mortgages for low-cost homes has made homeownership even harder at the most affordable end of the spectrum. Only one in four homes purchased for $70,000 or less in 2015 was financed with a mortgage, compared with almost 80 percent of homes worth between $70,000 and $150,000.
There are many reasons why it’s harder to get a mortgage for the more than 600,000 homes for sale nationwide at or below $70,000, but one common reason mentioned is that small-dollar mortgage loans are riskier because the potential buyers of these homes have worse credit profiles and the loans don’t perform as well.
We recently took a closer look at the data and debunked this myth. The data show that small-dollar mortgage borrowers have comparable credit profiles to borrowers of midsize mortgages and that the loans perform similarly.
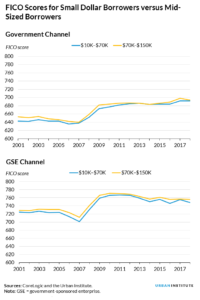
Small-dollar borrowers have comparable credit profiles
Although fewer small-dollar mortgages are originated each year, those who have been able to get one of these loans have comparable credit profiles to those who obtain midsize mortgages across the government, portfolio, government-sponsored enterprise (GSE), and private-label security (PLS) channels. Within the GSE and government-insured loan channels, for example, the FICO scores of small and midsized loan borrowers have consistently been within 10 points of each other for the past 17 years.
The loan-to-value (LTV) ratios are comparable as well, and debt-to-income (DTI) ratios are actually about 3 to 4 percentage points lower for small-dollar mortgage borrowers across all channels, likely because of lower monthly payments from lower loan balances.
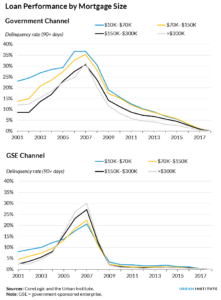
Small-dollar loans also perform similarly to loans with higher balances
In general and through time, small-dollar mortgage loans perform similarly to loans with higher balances. Part of the relatively small difference in performance can be explained by the similarly small differences in credit scores, DTI ratios, and LTV ratios discussed above.
For example, in the government channel, during the precrisis period, small-dollar mortgages had noticeably higher default rates, and borrowers of those loans had lower credit scores. When the credit score gap narrowed following the crisis, the default rate gap also narrowed.
In contrast, in the GSE and portfolio channels, small-dollar mortgages have consistently lower credit scores, but they performed close to, and in some cases better than, their larger loan counterparts during the housing boom years leading up to the crisis. For example, for 2006 origination cohorts, the default rates were 17.5 percent for loans up to $70,000 and 18.6 percent for loans between $70,000 and $150,000.
Our analysis shows that borrowers of small-dollar mortgages pose relatively the same risk as those with midsize mortgages and that these loans perform similarly.
We hope that by debunking the myth of the riskiness of small-dollar mortgages, steps can be taken to improve the availability and viability of financial products and that improvements can be made to mortgage lending for low-cost properties to help potential low- and moderate-income households in markets across America become homeowners.
About the Authors: Alanna McCargo if VP of Housing Finance Policy for the Urban Institute. Sarah Strochak is a research analyst in the Housing Finance Policy Center at the Urban Institute.
Read more...CFPB Announces Policy Change Regarding Bureau Civil Investigative Demands
- Tuesday, 23 April 2019

In an effort to increase transparency and move away from its “regualation by enforcement” stereotype, the CFPB on Tuesday announced that it is changing it’s policy on Civil Investigation Demands (CID’s). The new poicy will ensure the CFPB provides more information about the potentially wrongful conduct under investigation.CIDs will also typically specify the business activities subject to the Bureau’s authority. In investigations where determining the extent of the Bureau’s authority over the relevant activity is one of the significant purposes of the investigation, staff may specifically include that issue in the CID in the interests of further transparency.
The new policy takes into account recent court decisions about notifications of purpose and is consistent with a 2017 report by the Bureau’s Office of Inspector General that emphasized the importance of updating Office of Enforcement policies to reflect such developments. The new policy is also consistent with comments the Bureau received in response to the Requests for Information it issued in 2018.
The Consumer Financial Protection Act of 2010 authorizes the Bureau to issue investigational subpoenas known as CIDs when looking into potential violations of law. The Act provides that each CID “shall state the nature of the conduct constituting the alleged violation which is under investigation and the provision of law applicable to such violation.” CIDs issued by the Bureau set out this information in a section known as the “notification of purpose.”
Read more...
Black Knight's "First Look" Shows Delinquencies Down, Prepayments Up
- Tuesday, 23 April 2019

According to Black Knight’s “first look” report on March mortgage performance statistics, total U.S. loan delinquency ( defined as loans 30 or more days past due but not in foreclosure) fell 5.3% to 3.65%. This is down almost 2% from this time last year. This represented the smallest improvement for any March, typically the strongest performing month of the year, in six years. This comes on the heels of Februarys atypical increase in delinquencies.
While delinquencies haven’t been falling as fast as expected recently, they are still going down. Outstanding 90-day delinquencies are now at 493,000, down 8,000 vs February and down 139,000 from prior year. They have now fallen below 500,000 for the first time in more than 12 years. March’s 39,700 foreclosure starts marked the lowest single-month volume in more than 18 years. A reduced outflow of mortgages working through the foreclosure process held the active foreclosure inventory steady at 264,000.
In response to the decline in interest rates and the start of homebuying season, prepayment activity increased by 28% month-over-month, the largest single-month increase in more than 2.5 years.
This data is extrapolated based on Black Knights loan-level database of mortgage assets which represents the majority of the national mortgage market.
Non-current totals combine foreclosures and delinquencies as a percent of active loans in that state. Here is a list of the top and bottom performing states.
| Top 5 States by Non-Current* Percentage | |
| Mississippi: | 10.25% |
| Louisiana: | 7.94% |
| Alabama: | 6.87% |
| West Virginia: | 6.32% |
| Arkansas: | 5.94% |
| Bottom 5 States by Non-Current* Percentage | |
| California: | 2.36% |
| Idaho: | 2.25% |
| Washington: | 2.18% |
| Oregon: | 2.16% |
| Colorado: | 1.91% |
| Top 5 States by 90+ Days Delinquent Percentage | |
| Mississippi: | 3.11% |
| Louisiana: | 2.09% |
| Alabama: | 1.95% |
| Arkansas: | 1.78% |
| Delaware: | 1.38% |
|
Top 5 States by 6-Month Improvement in Non-Current* Percentage |
|
| North Carolina: | -11.38% |
| Washington: | -11.13% |
| Indiana: | -10.42% |
| Ohio: | -9.96% |
| Kentucky: | -9.78% |
| Top 5 States by 6-Month Deterioration in Non-Current* Percentage | |
| Rhode Island: | 2.46% |
| Maine: | -0.21% |
| Mississippi: | -0.75% |
| Virginia: | -2.96% |
| Louisiana: | -3.08% |
Read more...