
OTHER NEWS

The Learning Center
Our Learning Center ensures that every reader has a resource that helps them establish and maintain a competitive advantage, or leadership position. For instance, loan originators and brokers will have one-click access to resources that will help them increase their productivity. Search topics by category and keyword and generate free videos, webinars, white papers and other resources. If you would like to add your content to the learning center, please click here or email Tim Murphy at [email protected].

tim
State Flood Insurance Rates Vary Greatly, Even Among Coastal States
- Wednesday, 08 May 2019

A new ValuePenguin.com study has found that while flood insurance in states like Texas and Florida cost $581 and $550 a year on average, flood insurance in Rhode Island and New York cost $1389 and $1155 respectively. Additionally, just 7 percent of American homeowners have a flood insurance policy, compared to the 91 percent of owner-occupied homes who have homeowners insurance.
With the 2019 Atlantic hurricane season less than a month away, the need for flood insurance has never been more urgent. Nearly three-fourths of U.S. adults think destructive weather events such as hurricanes are getting worse, and over 40 percent of Americans have encountered weather events that caused property damage or forced them to evacuate their homes. Yet flood insurance coverage ratios vary widely by state.
 Key Findings:
- The states with the highest percentage of homeowners with flood insurance are Louisiana (44 percent), Florida (36 percent), Hawaii (23 percent), South Carolina (16 percent) and New Jersey (11 percent).
- The states with the lowest rate of coverage are Minnesota (0.6 percent), Utah (0.6 percent), Michigan (0.8 percent), Wisconsin (0.8 percent) and Ohio (1.1 percent).
- The average cost of a flood insurance policy through the National Flood Insurance Program (NFIP) is $699 per year, but flood insurance premiums vary significantly across the country.
[adbutler zone_id="325884" type="asyncjs1.1" ]
[adbutler zone_id="325888" type="asyncjs1.1" ]
- The five most expensive states to purchase flood insurance are Connecticut, Rhode Island, Vermont, Massachusettsand Pennsylvania, where premiums are 69-100 percent above the national average. On the flip side, NFIP policies in Texas, Maryland and Florida are the cheapest in the nation, and cost 17-21 percent below the national average.
ValuePenguin calculated share of homeowners with a flood insurance policy by comparing NFIP policies in force (source: FEMA) to owner-occupied housing units (source: U.S. Census Bureau). Their analysis does not include private flood insurance policies, which make up a minimal share of the overall flood insurance market.
| State | Share of | Rank (1st | Yearly | Difference | Flood |
| Homeowners | indicates the | Flood | from | Insurance Cost | |
| with Flood | state with the | Insurance | Average | Rank (1st | |
| Insurance | most | Premium | indicates the | ||
| widespread | state paying | ||||
| coverage) | the least) | ||||
| Louisiana | 43.50% | 1 | $664 | -5% | 5 |
| Florida | 35.50% | 2 | $550 | -21% | 1 |
| Hawaii | 22.80% | 3 | $673 | -4% | 8 |
| South Carolina | 15.50% | 4 | $672 | -4% | 7 |
| New Jersey | 11.10% | 5 | $961 | 37% | 33 |
| Delaware | 10.40% | 6 | $724 | 4% | 15 |
| Texas | 10.20% | 7 | $581 | -17% | 3 |
| Mississippi | 8.50% | 8 | $695 | -1% | 12 |
| Rhode Island | 5.60% | 9 | $1,389 | 99% | 49 |
| North Dakota | 5.40% | 10 | $677 | -3% | 9 |
| North Carolina | 5.20% | 11 | $814 | 16% | 20 |
| Virginia | 5.00% | 12 | $737 | 5% | 17 |
| New York | 4.60% | 13 | $1,155 | 65% | 46 |
| Maryland | 4.50% | 14 | $573 | -18% | 2 |
| Alabama | 4.30% | 15 | $687 | -2% | 11 |
| Connecticut | 4.20% | 16 | $1,395 | 100% | 51 |
| Massachusetts | 3.90% | 17 | $1,251 | 79% | 48 |
| Georgia | 3.70% | 18 | $684 | -2% | 10 |
| California | 3.50% | 19 | $806 | 15% | 19 |
| Oregon | 3.00% | 20 | $889 | 27% | 28 |
| West Virginia | 2.90% | 21 | $1,104 | 58% | 45 |
| New Mexico | 2.50% | 22 | $843 | 21% | 21 |
| Arkansas | 2.20% | 23 | $847 | 21% | 22 |
| New Hampshire | 2.20% | 24 | $1,060 | 52% | 42 |
| Washington | 2.20% | 25 | $901 | 29% | 30 |
| Nevada | 2.10% | 26 | $721 | 3% | 14 |
| Maine | 2.10% | 27 | $1,065 | 52% | 43 |
| Arizona | 2.10% | 28 | $666 | -5% | 6 |
| Vermont | 2.10% | 29 | $1,391 | 99% | 50 |
| Nebraska | 1.90% | 30 | $998 | 43% | 36 |
| Idaho | 1.90% | 31 | $746 | 7% | 18 |
| Kentucky | 1.80% | 32 | $971 | 39% | 34 |
| Montana | 1.70% | 33 | $704 | 1% | 13 |
| Tennessee | 1.70% | 34 | $861 | 23% | 25 |
| Pennsylvania | 1.70% | 35 | $1,176 | 68% | 47 |
| District of | 1.60% | 36 | $724 | 3% | 15 |
| Columbia | |||||
| South Dakota | 1.60% | 37 | $931 | 33% | 32 |
| Colorado | 1.60% | 38 | $856 | 22% | 23 |
| Alaska | 1.60% | 39 | $902 | 29% | 31 |
| Iowa | 1.50% | 40 | $1,045 | 49% | 40 |
| Oklahoma | 1.40% | 41 | $856 | 22% | 23 |
| Missouri | 1.30% | 42 | $1,071 | 53% | 44 |
| Indiana | 1.30% | 43 | $999 | 43% | 37 |
| Kansas | 1.30% | 44 | $882 | 26% | 26 |
| Wyoming | 1.30% | 45 | $888 | 27% | 27 |
| Illinois | 1.30% | 46 | $1,045 | 49% | 39 |
| Ohio | 1.10% | 47 | $1,047 | 50% | 41 |
| Wisconsin | 0.80% | 48 | $973 | 39% | 35 |
| Michigan | 0.80% | 49 | $1,008 | 44% | 38 |
| Utah | 0.60% | 50 | $654 | -6% | 4 |
| Minnesota | 0.60% | 51 | $900 | 29% | 29 |
Read more...
14% of Consumers Feel Its a Good Time to Buy, 43% Feel Its a Good Time to Sell
- Tuesday, 07 May 2019

The Fannie Mae Home Purchase Sentiment Index® (HPSI) dipped 1.5 points in April to 88.3, offsetting some of the prior month's 5.5 point jump. A decrease in the "Good Time to Buy" component helped drive the index lower, despite another supportive mortgage rate outlook from consumers. The net share of respondents expecting mortgage rates to go down over the next 12 months has risen a total of 12 percentage points over March and April.
"Households remain upbeat about economic activity but have more mixed attitudes toward the housing market," said Doug Duncan, senior vice president and chief economist at Fannie Mae. "While home selling confidence remains strong and more consumers on net expect mortgage rates to decline over the next year, respondents walked back some of their buying optimism from March. Improving perceptions of income gains and a softening home price growth outlook should help support housing demand. However, increasing expectations among consumers that mortgage rates will continue to be favorable for some time will likely gain additional support following last week's Fed meeting – and may also be reducing their urgency to buy."
HOME PURCHASE SENTIMENT INDEX – COMPONENT HIGHLIGHTS
Fannie Mae's 2019 Home Purchase Sentiment Index (HPSI) decreased in April by 1.5 points to 88.3. The HPSI is down 3.4 points compared with the same time last year.
- The net share of Americans who say it is a good time to buy a home decreased 8 percentage points to 14%. This component is down 15 percentage points from the same time last year.
- The net share of those who say it is a good time to sell a home remained unchanged at 43%. This component is down 2 percentage points from the same time last year.
- The net share of those who say home prices will go up decreased 2 percentage points to 36%. This component is down 13 percentage points from the same time last year.
- The net share of Americans who say mortgage rates will go down over the next 12 months increased 5 percentage points to -40%. This component is up 8 percentage points from the same time last year.
- The net share of Americans who say they are not concerned about losing their job decreased 6 percentage points to 74%. This component is down 2 percentage points from the same time last year.
- The net share of those who say their household income is significantly higher than it was 12 months ago increased 2 percentage points to 22%. This component is up 4 percentage points from the same time last year.
[adbutler zone_id="325884" type="asyncjs1.1" ]
[adbutler zone_id="325888" type="asyncjs1.1" ]
ABOUT FANNIE MAE'S HOME PURCHASE SENTIMENT INDEX
The Home Purchase Sentiment Index (HPSI) distills information about consumers' home purchase sentiment from Fannie Mae's National Housing Survey® (NHS) into a single number. The HPSI reflects consumers' current views and forward-looking expectations of housing market conditions and complements existing data sources to inform housing-related analysis and decision making. The HPSI is constructed from answers to six NHS questions that solicit consumers' evaluations of housing market conditions and address topics that are related to their home purchase decisions. The questions ask consumers whether they think that it is a good or bad time to buy or to sell a house, what direction they expect home prices and mortgage interest rates to move, how concerned they are about losing their jobs, and whether their incomes are higher than they were a year earlier.
ABOUT FANNIE MAE'S NATIONAL HOUSING SURVEY
The most detailed consumer attitudinal survey of its kind, Fannie Mae's National Housing Survey (NHS) polled approximately 1,000 Americans via live telephone interview to assess their attitudes toward owning and renting a home, home and rental price changes, homeownership distress, the economy, household finances, and overall consumer confidence. Homeowners and renters are asked more than 100 questions used to track attitudinal shifts, six of which are used to construct the HPSI (findings are compared with the same survey conducted monthly beginning June 2010). As cell phones have become common and many households no longer have landline phones, the NHS contacts 70 percent of respondents via their cell phones (as of January 2018). For more information, please see the Technical Notes. Fannie Mae conducts this survey and shares monthly and quarterly results so that we may help industry partners and market participants target our collective efforts to stabilize the housing market in the near-term, and provide support in the future. The April 2019 National Housing Survey was conducted between April 1, 2019 and April 23, 2019. Most of the data collection occurred during the first two weeks of this period. Interviews were conducted by PSB, in coordination with Fannie Mae.
Read more...CoreLogic: Housing Prices Continue to Increase
- Tuesday, 07 May 2019
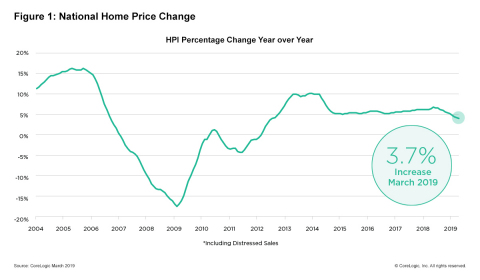
CoreLogic® just released the CoreLogic Home Price Index (HPI™) and HPI Forecast™ for March 2019, which shows home prices rose both year over year and month over month. Home prices increased nationally by 3.7% year over year from March 2018. On a month-over-month basis, prices increased by 1% in March 2019. (February 2019 data was revised. Revisions with public records data are standard, and to ensure accuracy, CoreLogic incorporates the newly released public data to provide updated results each month.)
Looking ahead, after some initial moderation in early 2019, the CoreLogic HPI Forecast indicates home prices will begin to pick up and increase by 4.8% on a year-over-year basis from March 2019 to March 2020. On a month-over-month basis, home prices are expected to decrease by 0.3% from March 2019 to April 2019. The CoreLogic HPI Forecast is a projection of home prices calculated using the CoreLogic HPI and other economic variables. Values are derived from state-level forecasts by weighting indices according to the number of owner-occupied households for each state.
[adbutler zone_id="325884" type="asyncjs1.1" ]
[adbutler zone_id="325888" type="asyncjs1.1" ]
“The U.S. housing market continues to cool, primarily due to some of our priciest markets moving into frigid waters,” said Dr. Ralph McLaughlin, deputy chief economist at CoreLogic. “But the broader market looks more temperate as supply and demand come into balance. With mortgage rates flat and inventory picking up, we expect more buyers to take advantage of easing housing market headwinds.”
According to the CoreLogic Market Condition Indicators (MCI), an analysis of housing values in the country’s 100 largest metropolitan areas based on housing stock, 35% of metropolitan areas have an overvalued housing market as of March 2019. The MCI analysis categorizes home prices in individual markets as undervalued, at value or overvalued, by comparing home prices to their long-run, sustainable levels, which are supported by local market fundamentals (such as disposable income). Additionally, as of March 2019, 26% of the top 100 metropolitan areas were undervalued, and 39% were at value.
When looking at only the top 50 markets based on housing stock, 40% were overvalued, 16% were undervalued and 44% were at value in March 2019. The MCI analysis defines an overvalued housing market as one in which home prices are at least 10% above the long-term, sustainable level. An undervalued housing market is one in which home prices are at least 10% below the sustainable level.
During the first quarter of 2019, CoreLogic together with RTi Research of Norwalk, Connecticut, conducted an extensive survey measuring consumer-housing sentiment in high-priced markets. The survey respondents indicated high home prices have an impact on high rental prices as well. Nearly 76% of renters and buyers in high-priced markets agreed housing prices in these markets appeared to be driving rental rates up.
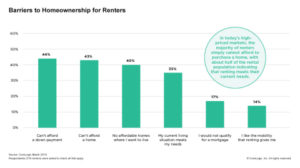 “The cost of either buying or renting in expensive markets puts a significant strain on most consumers,” said Frank Martell, president and CEO of CoreLogic. “Nearly half of survey respondents – 44% of renters – cited the cost to rent in high-priced housing markets as the number one barrier to entry into homeownership. This is potentially forcing renters to wait longer to have the necessary down payment in these communities.”