
-
 Navigating Commercial Lending in Today's Complex Market Explore the complexities of commercial lending in today's market, covering interest rate impacts, technological innovations, and sustainability trends.
Fannie's HPSI Holds Steady in February, Borrowers Less Bullish on Home Prices
- Friday, 08 March 2019
- Lending

The Fannie Mae Home Purchase Sentiment Index decreased 0.4 points in February to 84.3, reversing some of the increase seen in January. The HPSI is down 1.5 points compared with the same time last year.
The largest change among the HPSI components this month was a 9-percentage point drop in the net share of Americans who reported substantially higher household income compared to the same time last year, which was offset by an 8-percentage point jump in the job confidence component.
[caption id="attachment_9271" align="alignleft" width="396"] Doug Duncan[/caption]
“The HPSI held steady in February, as consumers’ continuing optimism about economic conditions seems to be balanced with softening attitudes toward the housing market,” said Doug Duncan, senior vice president and chief economist at Fannie Mae. “Job confidence reached a new survey high, but consumers were less optimistic about home buying and selling conditions than they were a year ago. Notably, home price growth expectations have trended significantly downward, with the net share of consumers expecting home prices to rise falling 19 percentage points from its survey high established at the start of 2018.”
[adbutler zone_id="326314"]
[adbutler zone_id="326316"]
Other highlights from the report are as follows:
- The net share of Americans who say it is a good time to buy a home remained unchanged this month at 15 percent. This component is down 7 percentage points compared with the same period in 2017.
- The net share of those who say it is a good time to sell a home decreased 5 percentage points to 30 percent. This component is down 6 percentage points from the same time last year.
- The net share of those who say home prices will go up increased 3 percentage points to 33 percent. This component is down 12 percentage points from the same time last year.
- The net share of Americans who say mortgage rates will go down over the next 12 months increased 1 percentage point to -52 percent. This component is up 5 percentage points compared with the same time period in 2017.
- The net share of Americans who say they are not concerned about losing their job increased 8 percentage points to 81 percent. This component is up 10 percentage points from the same time last year.
- The net share of those who say their household income is significantly higher than it was 12 months ago decreased 9 percentage points to 18 percent. This component is up 1 percentage point from the same time last year.
Read more...
LoanBeam Integrates with Freddie Mac’s Automated Underwriting System
- Tuesday, 05 March 2019
- Lending

LoanBeam, a provider of automated income calculations from digital tax return data, that their technology was integrated with Freddie Mac's automated underwriting system. Loan Product Advisor's asset and income modeler for self-employed borrowers, along with LoanBeam's platform, can speed the loan-origination process for them.
"In today's competitive housing market, lenders rely on technology to help them stay competitive," said Sri Gajjala, chief product officer at LoanBeam. "We are proud that our fully integrated solution can help expedite the loan closing process."
[adbutler zone_id="326314"]
[adbutler zone_id="326316"]
In 2018, Freddie Mac introduced automated income capabilities, including LoanBeam's Qualified Income Calculator. LoanBeam's technology works seamlessly with Loan Product Advisor AIM for self-employed to promote automation, accuracy and consistency in the complex process of assessing income for self-employed borrowers during the underwriting process.
"Technology is advancing the housing industry in ways that can help all borrowers," said Rick Lang, vice president of loan advisor strategy and integration at Freddie Mac. "Our partnership with LoanBeam keeps Freddie Mac on the cutting edge of providing innovative solutions and the best service to lenders in the industry."
Read more...
CoreLogic Offers Automated Valuation Solutions
- Wednesday, 06 March 2019
- Lending

CoreLogic has unveiled its Total Home Value for Marketing solution. This is the latest addition to the CoreLogic Total Home Value suite, or Automated Valuation Models, that incorporate new technologies to help deliver more accurate home values.
This step is part of the company’s plan to enhance its appraisal management company services, attain a 30 percent margin target, and enhance organic growth rates in 2020.
It’s designed to help clients reduce customer acquisition costs through refined customer segmentation, enhanced list yield, and the highest hit-rate of any Total Home Value AVM, the marketing tool can potentially maximize a firm’s prospecting capabilities.
Total Home Value for Marketing is a part of the CoreLogic Total Home Value suite, which makes the automated valuation models selection and budgeting process more straight forward than was possible in the past. Many AVMs on the market today are designed for broad applications. As a result, businesses may be using AVMs that are not designed to support their specific use case.
[adbutler zone_id="326314"]
[adbutler zone_id="326316"]
In contrast, Total Home Value, enables users to support a business case--such as originations, risk management, portfolio monitoring, marketing, or consumer), and select the solution that matches the need. This approach can deliver a level of consistency in valuations across the loan lifecycle as all Total Home Value solutions are built on a common model technology.
“Total Home Value for Marketing is part of our ongoing effort to transform the way AVMs are [used] within the mortgage and related industries,” said Ann Regan, executive for product management of Collateral Solutions for CoreLogic. “With a high hit-rate that does not unduly sacrifice accuracy, this solution ensures that any business looking to target specific clients based on home value, be they mortgage lenders, credit card providers, or auto dealers won’t leave any viable prospects on the table or misjudge the value of collateral at the outset.”
Read more...CoreLogic Reports January Home Prices Increased by 4.4 Percent Year Over Year
- Tuesday, 05 March 2019
- Lending
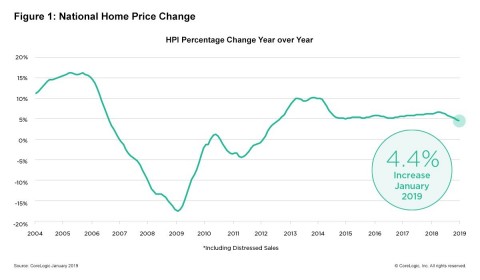
CoreLogic released the CoreLogic Home Price Index and HPI Forecast for January 2019, which shows home prices rose both year over year and month over month. Home prices increased nationally by 4.4 percent year over year from January 2018. This represents the slowest twelve-month home price growth rate since August 2012. On a month-over-month basis, prices increased by 0.1 percent in January 2019.
“As we head into 2019, we can expect continued strong employment growth and rising incomes which could support a reacceleration in home-price appreciation later this year.”
Looking ahead, the CoreLogic HPI Forecast indicates that the 2019 annual average home price will increase 3.4 percent above the 2018 annual average. On a month-over-month basis, home prices are expected to decrease by 0.9 percent from January 2019 to February 2019. The CoreLogic HPI Forecast is a projection of home prices calculated using the CoreLogic HPI and other economic variables. Values are derived from state-level forecasts by weighting indices according to the number of owner-occupied households for each state.
[adbutler zone_id="326314"]
[adbutler zone_id="326316"]
“The spike in mortgage interest rates last fall chilled buyer activity and led to a slowdown in home sales and price growth,” said Dr. Frank Nothaft, chief economist for CoreLogic. “Fixed-rate mortgage rates have dropped 0.6 percentage points since November 2018 and today are lower than they were a year ago. With interest rates at this level, we expect a solid home-buying season this spring.”
According to the CoreLogic Market Condition Indicators (MCI), an analysis of housing values in the country’s 100 largest metropolitan areas based on housing stock, 35 percent of metropolitan areas have an overvalued housing market as of January 2019. The MCI analysis categorizes home prices in individual markets as undervalued, at value or overvalued, by comparing home prices to their long-run, sustainable levels, which are supported by local market fundamentals (such as disposable income). Additionally, as of January 2019, 27 percent of the top 100 metropolitan areas were undervalued, and 38 percent were at value.
When looking at only the top 50 markets based on housing stock, 40 percent were overvalued, 18 percent were undervalued and 42 percent were at value in January 2019. The MCI analysis defines an overvalued housing market as one in which home prices are at least 10 percent above the long-term, sustainable level. An undervalued housing market is one in which home prices are at least 10 percent below the sustainable level.
Since peaking at 6.6 percent last April, annual home price gains have declined or held steady each month. “The slowing growth in home prices was inevitable in many respects as buyers pull back in the face of higher borrowing and ownership costs,” said Frank Martell, president and CEO of CoreLogic. “As we head into 2019, we can expect continued strong employment growth and rising incomes which could support a reacceleration in home-price appreciation later this year.”
Read more...


