-
 Navigating Commercial Lending in Today's Complex Market Explore the complexities of commercial lending in today's market, covering interest rate impacts, technological innovations, and sustainability trends.
Stewart, Fidelity 'Disagree' with New York Regulator’s Disapproval Notice on Merger
- Thursday, 14 February 2019
- Lending

Stewart Information Services Corp. has reported consolidated pretax income of $19.7 million in the fourth quarter of 2018, compared to $17.5 million in the same period a year earlier.
The title business generated pretax income of $29.5 million in the fourth quarter of 2018, compared to $27.0 million in the same period a year earlier. Also, pretax margin improved 120 basis points in fourth quarter of 2018 over the prior year quarter.
Commercial fee income increased 3 percent a file and domestic residential fee income a file increased 11 percent compared to fourth quarter of 2017. Stewart reported net income of $11.4 million for the fourth quarter 2018, compared to net income of $15.1 million for the fourth-quarter of 2017.
A $3 million expense for a third-party to advise on the Fidelity National Financial merger was taken in the fourth quarter of 2018, compared to $2.9 million in the same period one year earlier. And Stewart is continuing to work on the regulatory process with Fidelity National to satisfy the regulatory requirements for closing a merger, including those of the Federal Trade Commission, the Texas Department of Insurance and the New York State Department of Financial Services.
[adbutler zone_id="326325"]
[adbutler zone_id="326327"]
As previously disclosed, on Jan. 31, 2019, the NYDFS provided written notice of its disapproval of Fidelity National's application to acquire control of Stewart Title Insurance Co., Stewart’s New York domiciled title insurance underwriter.
The companies are discussing the notice with NYDFS and seek to resolve the regulators concerns, with which Stewart and Fidelity National “respectfully disagree,” according to the fourth quarter earnings report from Stewart.
Title operating revenues in the fourth quarter of 2018 decreased 10 percent compared to the prior year quarter as direct title, decreased 7 percent, and independent agency revenues decreased 12 percent.
Non-commercial domestic revenues for the fourth quarter are revenues from purchase transactions, which decreased $5 million, and centralized title operations, processing primarily refinancing and default title orders, declined $5.7 million compared to the fourth quarter of 2017. These declines were due to the lower purchase and refinancing closed orders, which decreased 16 percent in the fourth quarter 2018 compared to the prior year quarter.
Fourth quarter 2018 commercial revenues decreased $5.9 million, or 8 percent, compared to the fourth quarter 2017. Fourth quarter 2018 commercial fee for each file increased 3 percent to around $10,300 due to increased transaction sizes, while the domestic residential fee for each file increased 11 percent to around $2,300 because of the switch to a mortgage purchase market.
Commercial and domestic residential fees per file for the full year 2018 increased to $8,600 (22 percent) and $2,200 (8 percent), respectively, compared to last year. Gross revenues from independent agency operations declined 12 percent in the fourth quarter 2018, as compared to last year's quarter, due to reduced activity in high-volume states, which include New York, Texas, Florida and California.
Read more...Black Knight Revenues Rise 6%; Loan Origination Solution up 35%
- Wednesday, 13 February 2019
- Lending

Black Knight reported that its revenues for the year ended Dec. 31, 2018, increased 6 percent to $1,114.0 million, compared to $1,051.6 million in 2017. Earnings for the same time period were $168.5 million, or $1.14 per share, compared to $182.3 million, or $1.47 per diluted share, in 2017.
In the fourth quarter, revenues from the software solutions business increased 6% to $245.8 million.
Servicing software solutions generated revenue growth of 7% due to strong loan growth in the core servicing software platform from new and existing clients, higher average revenue per loan and new client wins.
Origination software revenue increased 4 percent, driven by 35 percent growth in the results of loan origination solution, which were negated by lower volumes on the exchange and eLending platforms, reflecting a 40 percent decline in refinancing activity, according to the Mortgage Bankers Association.
Black Knight has migrated PNC, Fifth Third, Navy Federal Credit Union and Santander Bank onto the Empower loan origination system. Also, around a year ago, JPMorgan Chase and CitiMortgage licensed Empower.
[caption id="attachment_9954" align="alignright" width="182"] Anthony Jabbour[/caption]
“I'm thrilled to say that we completed the implementation for both JPMorgan Chase and CitiMortgage onto Empower in less than a year,” said Anthony Jabbour, chief executive officer for Black Knight, who was speaking at the firm’s quarterly earnings call with analysts. “We worked [with] our clients to achieve these expedited timelines and are continually focused on improving our implementation process.”
JPMorgan Chase, Union Bank and Santander will deploy the home equity capability that Empower offers.
Data and Analytics revenues for the fourth quarter of 2018 increased 7 percent to $39.8 million, compared to $37.2 million in the prior year quarter driven by increases in portfolio analytics and multiple listing service businesses.
On the servicing side, Black Knight added more than million loans to the Loan Sphere mortgage servicing platform through implementation, such as KeyBank, FirstBank, Old National and Lake Michigan Credit Union.
Home equity loans comprised 19 percent of loans on the mortgage servicing platform at year-end, up from 13 percent a year earlier. Commerce Bank, a client for more than 30 years, extended its use of the MSP to home equity loans and home equity lines of credit and KeyBank and Regions will implement the home equity capability that the platform offers. Black Knight inked a multi-year renewal deal with Quicken Loans and the signing of ServiceMac as an MSP client.
On the digital mortgage side, in 2018 Black Knight unveiled Servicing Digital, which gives customers the ability to perform tasks and find information related to their mortgages. “We've signed eight clients since the launch of Servicing Digital last summer, including two of our top five clients,” said Jabbour, who says more announcements are imminent.
Other new digital products include Artificial Intelligence Virtual Assistant, Actionable Intelligence Platform and Rapid Analytics Platform were designed to increase efficiency.
“We believe that our growing collection of innovative solutions will help us expand our market share because they help our clients grow revenue and reduce the overall cost to originate and service loan,” said Jabbour.
One benefit is that these complementary products have a shorter, easier sales and implementation cycle, and that was the case with Amerifirst who was signed and was live in 2018 on the Servicing Digital capability—which means revenue will be generated sooner.
So far, these products generate a small percentage of the—though they’re a long-term play for the company.
“We certainly are expecting, we've signed a few clients and we expect to see revenue from them in 2019,” said Kirk Larsen, chief financial officer. “They'll each contribute to revenue in 2019, but I would say it's still on a relatively small basis, but we'll grow overtime and then the other are also in the earlier stages.”
Read more...Quicken: Valuations Diverge Between Appraisers, Homeowners
- Monday, 11 February 2019
- Lending
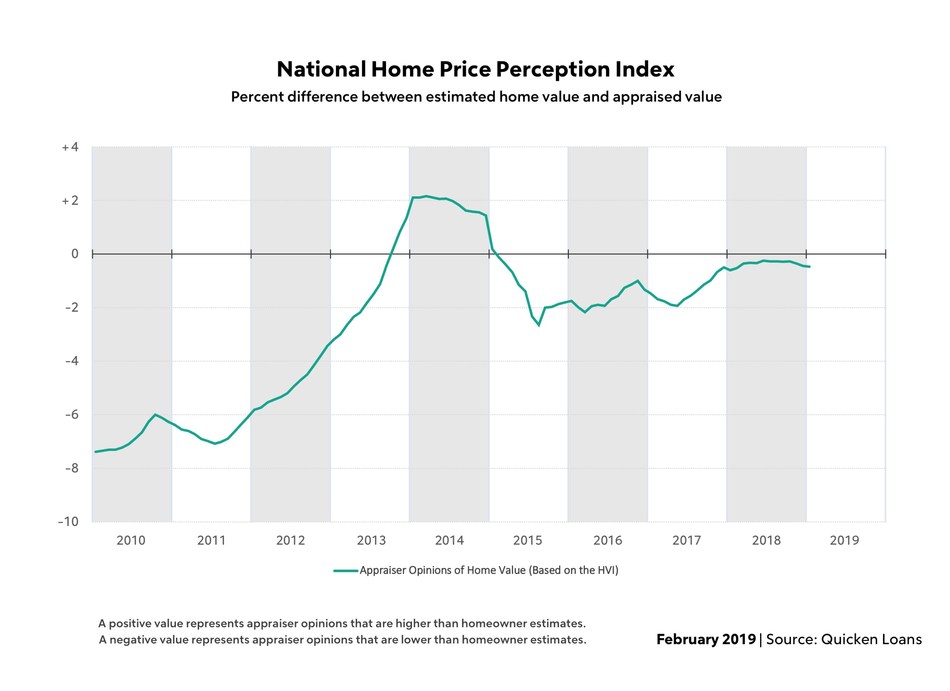
The average American homeowner thinks their home is appreciating faster than appraisers do.
Appraisal values in January were an average of 0.47 percent lower than what homeowners estimated, according the national Quicken Loans Home Price Perception Index.
January was the third consecutive month in which the gap between these data points widened from the previous month. While there is still a small gap between the two opinions, this emerging trend could be a sign that homeowners aren't aware of recent home value changes.
The metro HPPI measurements demonstrates how perception is changing across the U.S. Some of Western cities have seen their index values drop as their home-value growth slowed. San Francisco, for example, had average appraisals 2.11 percent higher than expected in January 2018. One year later, appraisals in the Bay Area are less than 1 percent higher than what homeowners estimate. All told, two thirds of the metro areas measured reported average appraisal values higher than what homeowners expected.
"It looks like the HPPI is seeing the start of a downward trend, in lock-step with pockets of moderating home values," said Bill Banfield, Quicken Loans Executive Vice President of Capital Markets. "However, with the national measure still reporting appraisals less than half of a percent lower than expected and with home values in the lowest performing metro area less than two percent lower than what homeowners estimated, the housing markets is still in a healthy place."
Even though homeowners may not have their finger on the pulse of home-value changes, appraisers have recorded fluctuations in select areas. Nationally, however, home values are still marching forward, but at a slower clip than last month. Appraisal values rose 0.65 percent January compared to December, according to the National Quicken Loans Home Value Index. In addition, the index showed healthy annual grow – with appraisal values rising 5.35 percent since January 2018.
The more notable changes to home values were reflected in the regional areas. There was a small monthly dip in appraisal values for homes in the West, 0.38 percent, and a nominal drop in the Midwest, 0.08 percent, and much more subdued annual appreciation in the West and South.
"As homes in each market adjust for the rate of price appreciation, buyers and sellers might find that there is more to negotiate--and some potential complications--if the purchase price isn't supported by the appraised value,” said Bill Banfield, executive vice president of capital markets at Quicken Loans. “The appraised value will be derived from recent, proximate sales, and are the leading indicator for the direction of the local market."
| HVI
January 2019 January 2005 = |
HVI
January 2019 vs. December 2018 % Change |
HVI
January 2019 vs. January 2018 % Change |
HPPI
January 2019
Appraiser Value vs. |
HPPI
January 2018
Appraiser Value vs. |
|
| National Composite | 111.94 | +0.65% | +5.35% | -0.47% | -0.60% |
*A positive value represents appraiser opinions that are higher than homeowner perceptions. A negative value represents appraiser opinions that are lower than homeowner perceptions.
|
Geographic Regions
|
HVI
January 2019
January 2005 = |
HVI
January 2019 vs. December 2018 % Change |
HVI
January 2019 vs. January 2018 % Change |
HPPI
January 2019
Appraiser Value vs. |
HPPI
January 2018
Appraiser Value vs. |
| West | 135.57 | -0.38% | +3.27% | -0.37% | -0.41% |
| South | 112.87 | +1.34% | +6.84% | -0.46% | -0.70% |
| Northeast | 91.47 | +0.59% | +4.74% | -0.47% | -0.72% |
| Midwest | 103.4 | -0.08% | +4.42% | -0.62% | -0.67% |
*A positive value represents appraiser opinions that are higher than homeowner perceptions. A negative value represents appraiser opinions that are lower than homeowner perceptions.
|
Metropolitan Areas
|
HPPI
January 2019
Appraiser Value vs. |
HPPI
December 2018
Appraiser Value vs. |
HPPI
January 2018
Appraiser Value vs. |
| Boston, MA | +2.76% | +2.98% | +1.90% |
| Charlotte, NC | +2.24% | +2.23% | +1.07% |
| Denver, CO | +2.17% | +2.36% | +2.18% |
| San Jose, CA | +1.91% | +1.86% | +2.58% |
| Minneapolis, MN | +1.70% | +1.91% | +1.02% |
| Seattle, WA | +1.64% | +1.69% | +1.96% |
| Dallas, TX | +1.39% | +1.37% | +2.83% |
| Las Vegas, NV | +1.13% | +1.10% | +0.60% |
| San Diego, CA | +0.94% | +1.10% | +1.13% |
| Atlanta, GA | +0.86% | +0.93% | -0.09% |
| Kansas City, MO | +0.76% | +1.04% | +0.80% |
| San Francisco, CA | +0.74% | +1.14% | +2.11% |
| Phoenix, AZ | +0.73% | +0.60% | +0.59% |
| Washington, D.C. | +0.60% | +0.74% | +0.33% |
| Sacramento, CA | +0.46% | +0.55% | +0.84% |
| Portland, OR | +0.26% | +0.51% | +1.05% |
| Los Angeles, CA | +0.10% | +0.31% | +0.93% |
| Riverside, CA | +0.02% | +0.27% | +0.54% |
| Houston, TX | -0.23% | -0.35% | -0.61% |
| New York, NY | -0.27% | -0.18% | +0.13% |
| Miami, FL | -0.35% | -0.17% | +0.75% |
| Detroit, MI | -0.59% | -0.18% | +0.41% |
| Tampa, FL | -0.69% | -0.73% | +0.44% |
| Baltimore, MD | -1.28% | -1.24% | -1.53% |
| Philadelphia, PA | -1.30% | -1.31% | -1.87% |
| Cleveland, OH | -1.64% | -1.33% | -1.95% |
| Chicago, IL | -1.87% | -1.96% | -1.35% |
*A positive value represents appraiser opinions that are higher than homeowner perceptions. A negative value represents appraiser opinions that are lower than homeowner perceptions.
Read more...Black Knight, Others Complete D&B Acquisition; Foley Ascends to Chairman
- Monday, 11 February 2019
- Lending

An investor group led by Black Knight Inc. and others has completed the acquisition of Dun & Bradstreet Inc., which had already been announced. The other lead investors include Cannae, CC Capital Partners, Bilcar, and funds affiliated with Thomas H. Lee Partners.
William P. Foley, was appointed executive chairman of the board for Dun & Bradstreet. Also, he will remain as chairman of the board of Cannae Holdings and Fidelity National Financial as well as executive chairman of the board of Black Knight. It provides integrated software, data and analytics solutions mortgage lenders and servicers.
Anthony Jabbour, chief executive officer at Black Knight, will serve as chief executive officer of Dun & Bradstreet, remaining in his current role at Black Knight.
Also, Stephen C. Daffron, a co-founder of Motive Partners and former president and chief executive officer of Interactive Data Corp., will serve as president of Dun & Bradstreet, which is now a private company and will no longer trade on the New York Stock Exchange.
“As a private company, Dun & Bradstreet is well positioned to reinvigorate growth and I look forward to partnering with Anthony, Stephen and the board in my new role,” said Foley. “Building on Dun & Bradstreet’s strong platform as a global leader in business insights, I look forward to improving growth and customers’ experience, while increasing operating efficiencies to deliver enhanced business solutions across the world."
Black Knight invested most of the $375 million paid for the transaction to purchase the equity interests of another consortium member. Of that investment, $250 million was used to purchase the ownership interest of QIA FIG Holding, a Doha, Qatar-based financial company, according to a Form 8-K it filed with the Securities and Exchange Commission.
The remaining $125 million is an equity commitment to the consortium, Star Parent LP. The investment in Dun & Bradstreet would yield less than a 20-percent share in Dun & Bradstreet. As a result of the completion of the transaction, shares of Dun & Bradstreet stock ceased trading on the New York Stock Exchange.
Cannae has acquired over 100 companies worth more than $30 billion along with Fidelity National Financial and others over the past 20 years. CC Capital is a private investment firm founded in 2016, which invests in and operates high-quality companies.
William and Carol Foley own Bilcar, a partnership that invested in the D&B transaction. He and his team achieved $312 million in cost reductions from the Lender Processing Services acquisition, surpassing a $150 million target. Foley has achieved around 1.3 times synergies in more than eight large transactions. Also, under his stewardship, Fidelity National grew into one of the largest title-insurance companies in the U.S. Thomas H. Lee Partners L.P. is a private equity firm that invests in growth companies in the U.S.
Read more...