
CoreLogic® (NYSE: CLGX), a leading global property information, analytics and data-enabled solutions provider, today released the Home Equity Report for the first quarter of 2019. The report shows that U.S. homeowners with mortgages (which account for roughly 63% of all properties) have seen their equity increase by 5.6% year over year, representing a gain of nearly $485.7 billion since the first quarter of 2018.
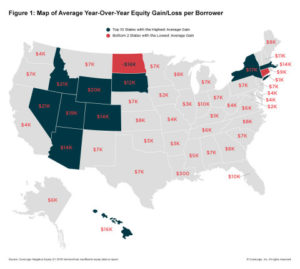
 The average homeowner gained $6,400 in home equity between the first quarter of 2018 and the first quarter of 2019. Some states saw much larger gains. In Nevada, homeowners gained an average of approximately $21,000. In Idaho, homeowners gained an average of approximately $20,700 and Wyoming homeowners gained an average of $20,300 (Figure 1).
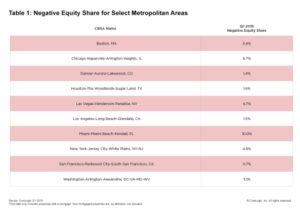
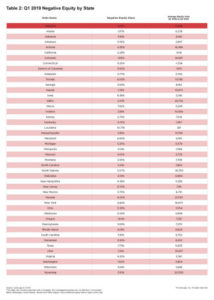
From the fourth quarter of 2018 to the first quarter of 2019, the total number of mortgaged homes in negative equity decreased 1% to 2.2 million homes or 4.1% of all mortgaged properties. The number of mortgaged properties in negative equity during the first quarter 2019 fell 11%, or by 268,000 homes, from 2.5 million homes, or 4.7% of all mortgaged properties, from the first quarter 2018.
“A moderation in home-price growth has reduced the gains in home-equity wealth and will likely slow the growth in home-improvement spending in the coming year,” said Dr. Frank Nothaft, chief economist for CoreLogic. “For larger remodeling projects, homeowners often choose to cash-out some of their home equity through a first-lien refinance or placement of a second lien.”
Negative equity, often referred to as being underwater or upside down, applies to borrowers who owe more on their mortgages than their homes are worth. Negative equity can occur because of a decline in a home’s value, an increase in mortgage debt or both. Negative equity peaked at 26% of mortgaged residential properties in the fourth quarter of 2009, based on the CoreLogic equity data analysis, which began in the third quarter of 2009.
The national aggregate value of negative equity was approximately $304.4 billion at the end of the first quarter of 2019. This is up approximately $2.5 billion from $301.9 billion in the fourth quarter of 2018 and up year over year by approximately $18 billion from $286.4 billion in the first quarter of 2018.
“The country continues to experience record economic expansion as illustrated by these increases in home equity,” said Frank Martell, president and CEO of CoreLogic. “We expect home equity to continue increasing nationally in 2019, albeit at a slower pace than in recent years.”
Methodology
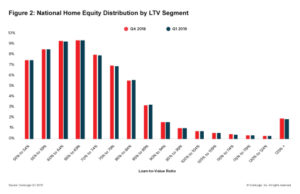
The amount of equity for each property is determined by comparing the estimated current value of the property against the mortgage debt outstanding (MDO). If the MDO is greater than the estimated value, then the property is determined to be in a negative equity position. If the estimated value is greater than the MDO, then the property is determined to be in a positive equity position. The data is first generated at the property level and aggregated to higher levels of geography. CoreLogic data includes more than 50 million properties with a mortgage, which accounts for more than 95% of all mortgages in the U.S. CoreLogic uses public record data as the source of the MDO, which includes both first-mortgage liens and second liens, and is adjusted for amortization and home equity utilization in order to capture the true level of MDO for each property. The calculations are not based on sampling, but rather on the full data set to avoid potential adverse selection due to sampling. The current value of the property is estimated using a suite of proprietary CoreLogic valuation techniques, including valuation models and the CoreLogic Home Price Index (HPI). In August 2016, the CoreLogic HPI was enhanced to include nearly one million additional repeat sales records from proprietary data sources that provide greater coverage in home price changes nationwide. The increased coverage is particularly useful in 14 non-disclosure states. Additionally, a new modeling methodology has been added to the HPI to weight outlier pairs, ensuring increased consistency and reducing month-over-month revisions. The use of the enhanced CoreLogic HPI was implemented with the Q2 2016 Equity report. Only data for mortgaged residential properties that have a current estimated value are included. There are several states or jurisdictions where the public record, current value or mortgage data coverage is thin and have been excluded from the analysis. These instances account for fewer than 5% of the total U.S. population. The percentage of homeowners with a mortgage is from the 2016 American Community Survey. Fourth quarter of 2017 data was revised. Revisions with public records data are standard, and to ensure accuracy, CoreLogic incorporates the newly released public data to provide updated results.