TRENDING WHITEPAPERS,VIDEOS & MORE
Black Knight: Delinquencies Hit Lowest Level Since 2000
- Wednesday, 23 January 2019
- Lending

Despite rising seasonally in recent months, only 3.9 percent of mortgages were delinquent as of December month-end, the lowest year-end total since Black Knight began reporting the figure in 2000.
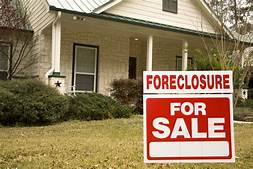
The national foreclosure rate, while also edging seasonally upward in December, posted the lowest year-end figure since 2005, with just 0.52 percent of mortgages in active foreclosure, according to “The First Look Report” from Black Knight.
However, foreclosure starts edged slightly upward with 46,300 starts reported for the month, a 2.4 percent uptick compared with the previous month.
Foreclosure starts were up 4 percent in December 2018 compared to the same period a year earlier, because of a hurricane-related moratorium on foreclosure starts in late 2017. Prepayments remained nearly unchanged in December, holding near the 10-year low set in November
Additional takeaways from the report are as follows:
Total U.S. loan delinquency rate (loans 30 or more days past due, but not in foreclosure): 3.88%
Month-over-month change: 4.71%
Year-over-year change: -17.55%
Total U.S. foreclosure pre-sale inventory rate: 0.52%
Month-over-month change: 1.19%
Year-over-year change: -19.23%
Total U.S. foreclosure starts: 46,300
Month-over-month change: 2.43%
Year-over-year change: 4.04%
Monthly prepayment rate (SMM): 0.66%
Month-over-month change: 0.03%
Year-over-year change: -29.02%
Foreclosure sales as % of 90+: 1.38%
Month-over-month change: -22.47%
Year-over-year change: 12.29%
Number of properties that are 30 or more days past due, but not in foreclosure: 2,013,000
Month-over-month change: 88,000
Year-over-year change: -399,000
Number of properties that are 90 or more days past due, but not in foreclosure: 511,000
Month-over-month change: 1,000
Year-over-year change: -215,000
Number of properties in foreclosure pre-sale inventory: 271,000
Month-over-month change: 3,000
Year-over-year change: -60,000
Number of properties that are 30 or more days past due or in foreclosure: 2,283,000
Month-over-month change: 90,000
Year-over-year change: -460,000
Ellie Mae: Lack of Inventory Forced Millennials to Buy Larger FHA Loans
- Monday, 21 January 2019
- Lending

Millennial homebuyers took out larger FHA-backed mortgage loans in November, compared with the same period one year ago.
Twenty-six percent of closed loans to Millennials in November were for FHA loans, with an average loan size of $186,454, up from $178,862 in November 2017, and $170,167 in November 2016, according to the Ellie Mae Millennial Tracker. Comparatively, Conventional loans accounted for 69 percent of closed loans made to Millennial borrowers during the same period, with an average loan amount of $211,268. Additionally, two percent of loans were for Veterans Affairs loans and three percent were unspecified.
FHA loans were more likely to be used by borrowers to purchase a home (95 percent), with just five percent of these type of loans going toward a refinance. Among conventional loans, 88 percent were for purchases and 11 percent were for refinances.
“November data from the Millennial Tracker shows that Millennial borrowers are taking out larger FHA mortgages and spending more on a home than in the past,” said Joe Tyrrell, executive vice president of corporate strategy for Ellie Mae. “For example, the average home appraisal value based on closed FHA loans for November 2018 in the San Francisco region was $562,479 compared to $523,192 a year ago at this same time, and up from $438,694 in 2016. We are seeing that as inventory remains relatively slim, borrowers are not waiting to buy an affordable home and are instead increasing their loan amount to purchase what is available on the market.”
Across the U.S., borrowers are taking out much larger FHA loans compared with previous years (as the highlighted averages for major metropolitan areas demonstrate below):
| Market | Avg. Loan Amount (Nov. 2018) | Avg. FHA Loan Amount (Nov. 2018) | Avg. Home Appraisal Value (for FHA Loans) (Nov. 2018) | Avg. Loan Amount (Nov. 2017) | Avg. FHA Loan Amount (Nov. 2017) | Avg. Home Appraisal Value (for FHA Loans) (Nov. 2017) |
| San Francisco-Oakland-Hayward | $642,877 | $505,871 | $562,479 | $523,633 | $460,853 | $523,192 |
| Los Angeles-Long Beach-Anaheim | $479,362 | $442,569 | $479,091 | $442,015 | $389,031 | $425,517 |
| Boston-Cambridge-Newton, Mass./N.H. | $376,481 | $353,680 | $379,897 | $367,733 | $343,219 | $370,635 |
| Washington, D.C.- Arlington-Alexandria | $351,631 | $313,168 | $331,633 | $334,156 | $283,584 | $305,467 |
| Chicago-Naperville- Elgin |
$221,962 | $194,630 | $207,841 | $205,667 | $178,335 | $189,715 |
Additional takeaways from the survey are as follows:
- Men were listed as the primary borrower for 56 percent of FHA loans, women were listed on 35 percent, and nine percent were unspecified
- It took an average of 43 days to close both FHA and conventional loans across the country, compared to the average of 42 days for all loans
- In November, 89 percent of all loans closed by Millennials were for purchases, with just 10 percent for refinances
- Interest rates on all loans rose to 5.1 percent, the highest percentage point since Ellie Mae started tracking this data in 2016, up from 4.96 percent in October, and up from 4.17 percent a year ago
- The average FHA loan borrower FICO score was 680 and the average score for those who opted for conventional loans was 744.
First American: Stock Market Volatility Benefits Home Buyers
- Monday, 21 January 2019
- Lending

Although mortgage rates are expected to continue to rise this year, last month’s stock market volatility stopped the increases. That’s because when the economy is doing well, investors prefer stocks over bonds, but economic weakness brings an appetite for the safety bonds offer investors.
“In December, the opposite happened. A steep sell-off in U.S. stocks caused by investors seeking safe-haven from global and domestic economic uncertainty caused the 10-year Treasury yield to decline, and mortgage rates fell alongside it,” said Mark Fleming, chief economist at First American. “In fact, the average 30-year, fixed-rate mortgage in December fell 23 basis points compared with the previous month. The December drop in mortgage rates increased the market potential for existing-home sales by 0.3 percent."
December 2018 Potential Home Sales
Potential existing-home sales increased marginally to a 6.15 million seasonally adjusted annualized rate (SAAR), a 0.3 percent month-over-month increase, according to the Potential Home Sales Model for December 2018 from First American Financial Corp. This represents a 64.7 percent increase from the market potential low point reached in February 2011.
In addition, the market potential for existing-home sales increased by 1.1 percent compared with a year ago, a gain of 69,000 (SAAR) sales. Currently, potential existing-home sales is 1.1 million (SAAR), or 15.6 percent below the pre-recession peak of market potential, which occurred in July 2005.
The Market Performance Gap
- The market for existing-home sales is underperforming its potential by 9.6 percent or an estimated 593,000 (SAAR) sales.
- The market performance gap decreased by an estimated 129,000 (SAAR) sales between November 2018 and December 2018.
"While we don’t expect falling mortgage rates to be the norm in 2019, the recent drop has benefited potential home buyers. In the face of falling mortgage rates, mortgage applications for the week ending January 4 jumped more than 20 percent from the previous week, even during the slower than usual holiday period,” said Fleming. “Uncertainty regarding world economic events and global trade agreements may lead to a further sell-off in equity markets, adding more downward pressure on mortgage rates. If this occurs, we can expect the market potential for existing-home sales to rise further.”
Read more...Rates Hold Steady: Freddie Mac
- Wednesday, 16 January 2019
- Lending

Interest rates remained flat after dropping for six consecutive weeks, according to the Primary Market Survey from Freddie Mac.
“Weaker manufacturing data and a more dovish tone from the Federal Reserve left mortgage rates unchanged relative to last week,” said Sam Khater, chief economist at Freddie Mac. “However, interest rate-sensitive sectors of the economy--such as consumer mortgage demand and homebuilder construction sentiment--are on the mend, which indicates that lower interest rates are beginning to have a positive impact on some segments of the economy.”
[caption id="attachment_9187" align="alignright" width="241"] Sam Khater[/caption]
Additional interest rate insights are as follows:
- The 30-year fixed-rate mortgage averaged 4.45 percent with an average 0.4 point for the week ending January 17, 2019, unchanged from last week. A year ago, the 30-year FRM averaged 4.04 percent.
- The 15-year fixed-rate mortgage this week averaged 3.88 percent with an average 0.4 point, down from last week when it averaged 3.89 percent. A year ago, the 15-year FRM averaged 3.49 percent.
- The 5-year Treasury-indexed hybrid adjustable-rate mortgage averaged 3.87 percent with an average 0.3 point, up from last week when it averaged 3.83 percent. A year ago, the 5-year ARM averaged 3.46 percent.


