-
 Navigating the Shifts in Commercial Lending: Analyzing Current Trends An in-depth look at recent trends in commercial lending, analyzing the impact of changing interest rates on the mortgage industry.
10 Hottest Neighborhoods in the U.S.
- Tuesday, 15 January 2019
- Originating
Expensive coastal hubs remain the most coveted places to live, but neighborhoods in Baltimore and Philadelphia are gaining popularity as the most desired, affordable neighborhoods in 2019, according to “Hottest Affordable Neighborhoods” a new report from Redfin.
Neighborhoods in Chicago, the Portland, Oregon and Boston metro areas and San Antonio also show up in the rankings. The report determines the hot neighborhoods that are affordable for the average homebuyer by incorporating a price cap of $294,000, the national median home price.
Below are the top-10 hottest-neighborhoods, based on median sale price, average sale-to-list price ratio and percent of homes that sold above list price from data gathered in November 2018
1.McKinley Park, Chicago,
Median sale price: $270,000
Median sale price for metro area: $230,000
Average sale-to-list price ratio: 97.9%
Percent of homes that sold above list price: 35.1
2. East Mount Airy, Philadelphia, PA
Median sale price: $200,000
Median sale price for metro area: $199,000
Average sale-to-list price ratio: 98%
Percent of homes that sold above list price: 28.1%
3. Parkville, Baltimore, MD
Median sale price: $204,900
Median sale price for metro area: $270,000
Average sale-to-list price ratio: 98.2%
Percent of homes that sold above list price: 24%
4. Hamilton, Baltimore, MD
Median sale price: $159,500
Median sale price for metro area: $270,000
Average sale-to-list price ratio: 98.5%
Percent of homes that sold above list price: 31.6%
5. Fircrest, Vancouver, Washington(Portland, Oregon metro area)
Median sale price: $282,500
Median sale price for metro area: $385,000
Average sale-to-list price ratio: 100.1%
Percent of homes that sold above list price: 20
6. Bustleton, Philadelphia, PA
Median sale price: $248,250
Median sale price for metro area: $199,000
Average sale-to-list price ratio: 98.1%
Percent of homes that sold above list price: 29.4%
7. Linthicum, Baltimore, Md.
Median sale price: $271,000
Median sale price for metro area: $270,000
Average sale-to-list price ratio: 99.4%
Percent of homes that sold above list price: 37%
8. Lowell, Boston, Mass.
Median sale price: $249,250
Median sale price for metro area: $471,100
Average sale-to-list price ratio: 102.5%
Percent of homes that sold above list price: 38.9%
9. Fox Chase, Philadelphia
Median sale price: $219,000
Median sale price for metro area: $199,000
Average sale-to-list price ratio: 98.4%
Percent of homes that sold above list price: 30.2%
10. Beacon Hill, San Antonio, Texas
Median sale price: $213,264
Median sale price for metro area: $220,000
Average sale-to-list price ratio: 98.5%
Percent of homes that sold above list price: 46.2%
Read more...
Freddie Mac: Mortgage Rates Drop Significantly
- Friday, 11 January 2019
- Originating

Mortgage rates have dropped significantly across the board, according to the “Primary Mortgage Market Survey” from Freddie Mac.
“Mortgage rates fell to the lowest level in nine months, and in response, mortgage applications jumped more than 20 percent,” said Sam Khater, Freddie Mac’s chief economist. “Lower mortgage rates combined with continued income growth and lower energy prices are all positive indicators for consumers that should lead to a firming of home sales.”
Additional takeaways on rates are as follows:
• The 30-year fixed-rate mortgage averaged 4.45 percent with an average 0.5 point for the week ending Jan. 10, 2019, down from last week when it averaged 4.51 percent. A year ago at this time, the 30-year fixed-rate mortgage averaged 3.99 percent.
• The 15-year fixed-rate mortgage averaged 3.89 percent with an average 0.4 point, down from last week when it averaged 3.99 percent. A year ago at this time, the 15-year fixed-rate mortgage averaged 3.44 percent.
• The 5-year Treasury-indexed hybrid adjustable-rate mortgage averaged 3.83 percent with an average 0.3 point, down from last week when it averaged 3.98 percent. A year ago at this time, the 5-year adjustable rate mortgage averaged 3.46 percent
Gen-Xers, Older Millennials Prefer Stocks to Real Estate
- Sunday, 06 January 2019
- Originating
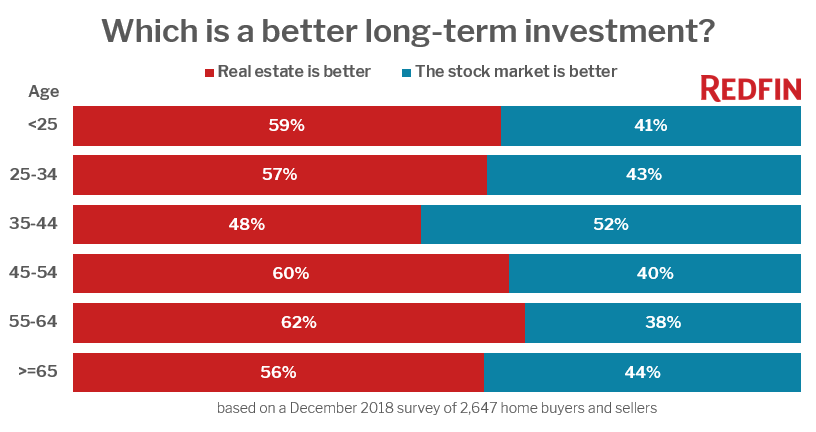
Less than half of homebuyers and sellers between the ages of 35 and 44 believe that real estate is a better long-term investment than the stock market, according to a survey from Redfin, a real estate brokerage.
Buyers who reached the median first-time homebuyer age of 31 years old between 2008 and 2012 during the Great Recession and housing market collapse are now 37 to 41 years old. This is the only age group that has less confidence in real estate as an investment than the stock market. Just 48 percent of homebuyers and sellers in this age group believe that real estate is a better long-term investment than the stock market.
 "The oldest Millennials and youngest Gen-Xers entered their late twenties or early thirties during the housing crash, which explains why they are more skeptical about investing in real-estate," said Redfin’s chief economist Daryl Fairweather. "This generation experienced a major setback during the housing bust, which hit just as they were most likely to be getting married, starting a family, and becoming a first-time homeowner. Looking into the future, we expect to see homeownership increase as Millennials enter prime home-buying age. This is because Millennials have a more favorable opinion of real estate as an investment than Gen-Xers, and Millennials are a larger group than Gen-Xers."
In every other age group, buyers and sellers who believe that real estate is a better long-term investment outnumbered those who believe the stock market is better. Younger Baby Boomers, respondents aged 55 to 64, were the most optimistic about real estate as an investment.
In December 2018, Redfin surveyed more than 2,600 people nationwide who at the time bought or sold a home in the last year, attempted to do so, or had plans to buy or sell in the near future.
Read more...Home Prices Increased in 2018
- Friday, 04 January 2019
- Originating
The CoreLogic Home Price Index and HPI Forecast for November 2018 shows home prices rose both year over year and month over month. Home prices increased nationally by 5.1 percent year over year from November 2017. On a month-over-month basis, prices increased by 0.4 percent in November 2018.
Looking ahead, the CoreLogic HPI Forecast indicates home prices will increase by 4.8 percent on a year-over-year basis from November 2018 to November 2019. On a month-over-month basis, home prices are expected to decrease by 0.8 percent from November to December 2018. The CoreLogic HPI Forecast is a projection of home prices calculated using the CoreLogic HPI and other economic variables. Values are derived from state-level forecasts by weighting indices according to the number of owner-occupied households for each state.
“The rise in mortgage rates has dampened buyer demand and slowed home-price growth,” said Dr. Frank Nothaft, chief economist for CoreLogic. “Interest rates for new 30-year fixed-rate loans averaged 4.9 percent during November, the highest monthly average since February 2011. These higher rates and home prices have reduced buyer affordability. Home sellers are responding by lowering their asking price, which is reflected in the slowing growth of the CoreLogic Home Price Index.”
According to the CoreLogic Market Condition Indicators, an analysis of housing values in the country’s 100 largest metropolitan areas based on housing stock, 35 percent of metropolitan areas have an overvalued housing market as of November 2018. The MCI analysis categorizes home prices in individual markets as undervalued, at value or overvalued, by comparing home prices to their long-run, sustainable levels, which are supported by local market fundamentals (such as disposable income). Additionally, as of November 2018, 27 percent of the top 100 metropolitan areas were undervalued, and 38 percent were at value.
When looking at only the top 50 markets based on housing stock, 44 percent were overvalued, 18 percent were undervalued and 38 percent were at value. The MCI analysis defines an overvalued housing market as one in which home prices are at least 10 percent above the long-term, sustainable level. An undervalued housing market is one in which home prices are at least 10 percent below the sustainable level.
“A strong economy helps homeowners feel confident about the value of their property,” said Frank Martell, president and CEO of CoreLogic. “If recent declines in the stock market shakes consumer confidence in the national economy, we may see homeowners’ perception of home value change and a subsequent buyers’ market emerge in 2019.”
Read more...


