

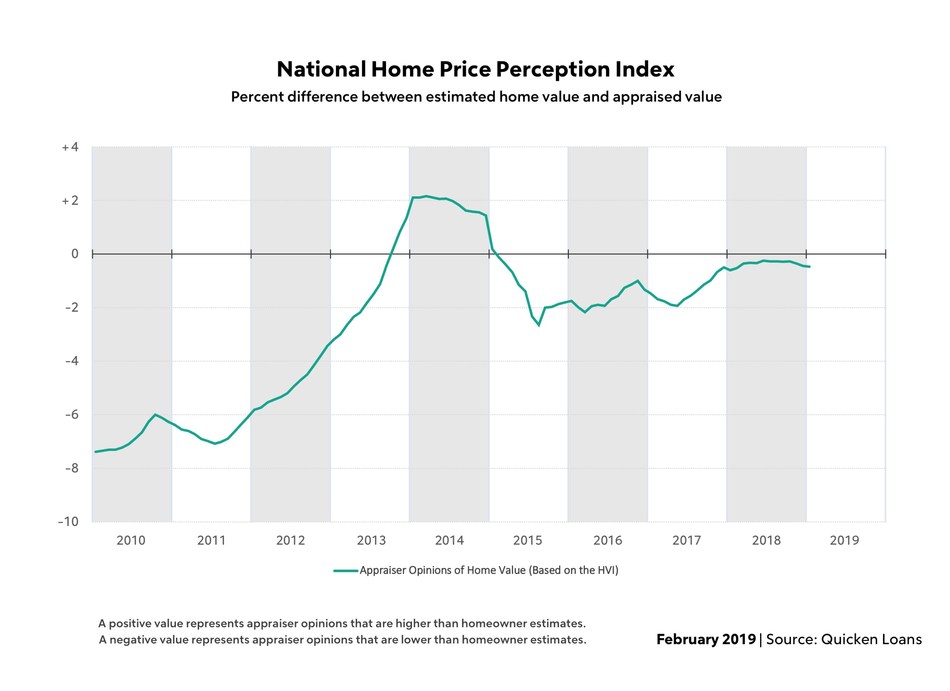
The average American homeowner thinks their home is appreciating faster than appraisers do.
Appraisal values in January were an average of 0.47 percent lower than what homeowners estimated, according the national Quicken Loans Home Price Perception Index.
January was the third consecutive month in which the gap between these data points widened from the previous month. While there is still a small gap between the two opinions, this emerging trend could be a sign that homeowners aren't aware of recent home value changes.
 The metro HPPI measurements demonstrates how perception is changing across the U.S. Some of Western cities have seen their index values drop as their home-value growth slowed. San Francisco, for example, had average appraisals 2.11 percent higher than expected in January 2018. One year later, appraisals in the Bay Area are less than 1 percent higher than what homeowners estimate. All told, two thirds of the metro areas measured reported average appraisal values higher than what homeowners expected.
"It looks like the HPPI is seeing the start of a downward trend, in lock-step with pockets of moderating home values," said Bill Banfield, Quicken Loans Executive Vice President of Capital Markets. "However, with the national measure still reporting appraisals less than half of a percent lower than expected and with home values in the lowest performing metro area less than two percent lower than what homeowners estimated, the housing markets is still in a healthy place."
Even though homeowners may not have their finger on the pulse of home-value changes, appraisers have recorded fluctuations in select areas. Nationally, however, home values are still marching forward, but at a slower clip than last month. Appraisal values rose 0.65 percent January compared to December, according to the National Quicken Loans Home Value Index. In addition, the index showed healthy annual grow – with appraisal values rising 5.35 percent since January 2018.
The more notable changes to home values were reflected in the regional areas. There was a small monthly dip in appraisal values for homes in the West, 0.38 percent, and a nominal drop in the Midwest, 0.08 percent, and much more subdued annual appreciation in the West and South.
"As homes in each market adjust for the rate of price appreciation, buyers and sellers might find that there is more to negotiate--and some potential complications--if the purchase price isn't supported by the appraised value,” said Bill Banfield, executive vice president of capital markets at Quicken Loans. “The appraised value will be derived from recent, proximate sales, and are the leading indicator for the direction of the local market."
| HVI
January 2019 January 2005 = |
HVI
January 2019 vs. December 2018 % Change |
HVI
January 2019 vs. January 2018 % Change |
HPPI
January 2019
Appraiser Value vs. |
HPPI
January 2018
Appraiser Value vs. |
|
| National Composite | 111.94 | +0.65% | +5.35% | -0.47% | -0.60% |
*A positive value represents appraiser opinions that are higher than homeowner perceptions. A negative value represents appraiser opinions that are lower than homeowner perceptions.
|
Geographic Regions
|
HVI
January 2019
January 2005 = |
HVI
January 2019 vs. December 2018 % Change |
HVI
January 2019 vs. January 2018 % Change |
HPPI
January 2019
Appraiser Value vs. |
HPPI
January 2018
Appraiser Value vs. |
| West | 135.57 | -0.38% | +3.27% | -0.37% | -0.41% |
| South | 112.87 | +1.34% | +6.84% | -0.46% | -0.70% |
| Northeast | 91.47 | +0.59% | +4.74% | -0.47% | -0.72% |
| Midwest | 103.4 | -0.08% | +4.42% | -0.62% | -0.67% |
*A positive value represents appraiser opinions that are higher than homeowner perceptions. A negative value represents appraiser opinions that are lower than homeowner perceptions.
|
Metropolitan Areas
|
HPPI
January 2019
Appraiser Value vs. |
HPPI
December 2018
Appraiser Value vs. |
HPPI
January 2018
Appraiser Value vs. |
| Boston, MA | +2.76% | +2.98% | +1.90% |
| Charlotte, NC | +2.24% | +2.23% | +1.07% |
| Denver, CO | +2.17% | +2.36% | +2.18% |
| San Jose, CA | +1.91% | +1.86% | +2.58% |
| Minneapolis, MN | +1.70% | +1.91% | +1.02% |
| Seattle, WA | +1.64% | +1.69% | +1.96% |
| Dallas, TX | +1.39% | +1.37% | +2.83% |
| Las Vegas, NV | +1.13% | +1.10% | +0.60% |
| San Diego, CA | +0.94% | +1.10% | +1.13% |
| Atlanta, GA | +0.86% | +0.93% | -0.09% |
| Kansas City, MO | +0.76% | +1.04% | +0.80% |
| San Francisco, CA | +0.74% | +1.14% | +2.11% |
| Phoenix, AZ | +0.73% | +0.60% | +0.59% |
| Washington, D.C. | +0.60% | +0.74% | +0.33% |
| Sacramento, CA | +0.46% | +0.55% | +0.84% |
| Portland, OR | +0.26% | +0.51% | +1.05% |
| Los Angeles, CA | +0.10% | +0.31% | +0.93% |
| Riverside, CA | +0.02% | +0.27% | +0.54% |
| Houston, TX | -0.23% | -0.35% | -0.61% |
| New York, NY | -0.27% | -0.18% | +0.13% |
| Miami, FL | -0.35% | -0.17% | +0.75% |
| Detroit, MI | -0.59% | -0.18% | +0.41% |
| Tampa, FL | -0.69% | -0.73% | +0.44% |
| Baltimore, MD | -1.28% | -1.24% | -1.53% |
| Philadelphia, PA | -1.30% | -1.31% | -1.87% |
| Cleveland, OH | -1.64% | -1.33% | -1.95% |
| Chicago, IL | -1.87% | -1.96% | -1.35% |
*A positive value represents appraiser opinions that are higher than homeowner perceptions. A negative value represents appraiser opinions that are lower than homeowner perceptions.
